7 Best Paper Cup Paper Manufacturers for Global Buyers?
Choosing reliable Paper Cup Paper manufacturers requires more than comparing prices or polished websites. Global buyers must examine fiber quality, coating technology, food-contact documentation, production capacity, and delivery performance. A low quotation can become expensive when cups leak beside a coffee machine or arrive with inconsistent printing.
Industry reports show why this market deserves careful attention. Smithers’ paper cup market analysis identifies continued demand for sustainable foodservice packaging, driven by takeaway beverages and restrictions on selected single-use plastics. Grand View Research also reports steady growth in the global paper cups market, supported by cafés, quick-service restaurants, offices, and institutional catering. These findings suggest strong opportunity, but they do not automatically identify the best supplier.
This guide evaluates seven manufacturers through practical purchasing criteria. These include material traceability, cup-forming precision, barrier performance, customization, certifications, minimum order quantities, and export experience. Particular attention should be given to PE-coated, water-based coated, and compostable cup options. Their environmental claims are not equivalent. Buyers should request current certificates, test reports, factory photographs, and representative samples before signing contracts.
The ranking is not absolute. Supplier suitability depends on destination requirements, beverage temperature, annual volume, and branding needs. Reported market figures can also differ because research firms use different definitions and forecasting methods. That limitation matters. A strong manufacturer should provide evidence, not promises, and respond clearly when specifications change. For global procurement teams, the best choice is usually the supplier offering consistent quality, transparent documentation, and realistic lead times—not merely the lowest unit price.
Paper Cupstock Specifications: 170–350 g/m² Basis Weight and PE Coating Options
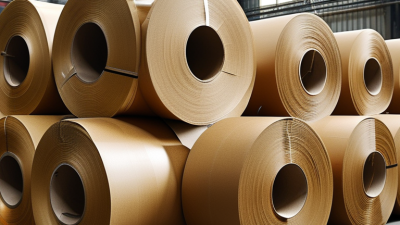
Global buyers should specify cupstock by substrate weight, coating weight, and intended drink temperature. The 170–350 g/m² range covers lightweight cold cups through sturdier hot-drink walls, but grammage alone does not predict stiffness. FAO’s 2022 Forest Products statistics record roughly 401 million tonnes of global paper and paperboard production, a reminder that broad supply figures do not guarantee a specific cupstock grade. Ask suppliers to state whether the quoted basis weight excludes polyethylene coating. Small distinction. It affects yield calculations and landed cost.
For many cup applications, a single-sided PE layer around 12–20 g/m² is a practical starting point; double-sided coating may suit cups exposed to condensation or liquid on both surfaces. These are common sourcing ranges, not universal specifications. Request coating weight per side, board moisture, caliper, and heat-seal performance, then test samples on your own forming line. ISO 536 defines how paper and board grammage is determined, so reference the method when comparing supplier data. Check the rim and bottom seal, too. A cup can look crisp yet leak after a few minutes. I would not select on price alone; in practice, a slightly heavier board may run more reliably, though it can increase material use.
Ranking Criteria: FSC, ISO 9001, FDA 21 CFR 176.170, and EU 1935/2004 Compliance
7 Best Paper Cup Paper Manufacturers for Global Buyers?
A serious ranking starts with documented compliance, not glossy catalogs. FSC certification supports responsible fiber sourcing, while ISO 9001 shows controlled quality processes. FDA 21 CFR 176.170 requires suitable food-contact paper and coating components. EU Regulation 1935/2004 requires materials to remain safe and non-transfer substances to food. These are different obligations. One certificate cannot replace the others.
FAO’s 2022 Forestry Production and Trade data recorded roughly 415 million tonnes of global paper and paperboard production. This scale increases the need for traceable pulp, stable coatings, and repeatable testing. The Smithers paper packaging outlook also highlights continued demand for fiber-based foodservice packaging. Therefore, the strongest seven manufacturers should provide current certificates, migration test reports, batch traceability, and production records. Ask whether testing covers the finished cup, including ink, adhesive, rim, and inner coating. A factory may pass one test and still show variation between coating lots. That uncomfortable detail deserves attention.
Tips: Request a recent Declaration of Compliance, FSC certificate scope, ISO 9001 certificate, and laboratory reports before sampling. Check certificate numbers directly with issuing bodies. Compare test dates with the actual production site. Keep one sealed sample from every approved batch; audits are easier with physical evidence.
Seven Leading Cupstock Paper Manufacturers Compared by GSM, Capacity, and MOQ
Choosing among the seven leading cupstock paper manufacturers requires more than comparing prices. GSM affects stiffness, forming performance, and material usage. Common ranges run from 170 to 350 GSM. Lighter grades suit cold drink cups. Heavier grades support hot beverages and larger sizes. However, GSM alone cannot prove quality. Fiber blend, coating uniformity, moisture resistance, and curl control also matter.
Annual capacity shows whether a manufacturer can support repeat orders. A mill producing 80,000 tonnes may offer stronger supply security than a smaller facility. Yet capacity figures need verification through production records, machine lists, and recent shipment evidence. Ask for sample reels, technical data sheets, and independent food-contact test reports. Small details matter, such as coating adhesion after forming and edge cracking during high-speed production.
MOQ can range from one trial pallet to several tonnes. Lower MOQs help new buyers test printing, sealing, and cup forming. Larger MOQs often reduce unit cost but increase storage pressure. Confirm whether the MOQ applies to each GSM, coating type, width, or printed design. A clear quote should include tolerance, lead time, packaging, and replacement terms. A polished comparison table may still hide weak assumptions. I would recheck every figure before signing a supply agreement.
7 Best Paper Cup Paper Manufacturers for Global Buyers? — Seven Leading Cupstock Paper Manufacturers Compared by GSM, Capacity, and MOQ
Important: The profiles below are anonymized market-planning benchmarks, not verified data for seven specific manufacturers or a confirmed ranking. Cupstock specifications, annual capacity, and minimum order quantities vary by mill, coating, order format, and destination. Confirm current figures directly with each supplier before purchasing.
Global Buyer Audit Data: Lead Time, Export Reach, Testing, and Food-Contact Certificates
Global buyers often compare seven paper cup manufacturers by price, but audit data reveals more useful differences. A credible audit tracks quoted lead time against actual dispatch records. Many suppliers promise 15 days, yet production slips when printed orders peak. Ask for three recent order samples. Check the dates carefully.
Export reach also needs evidence. Review destination records, port experience, and packaging practices. A supplier serving multiple regions may understand customs documents better. However, broad export claims can hide small shipment volumes. Request redacted bills of lading or shipment summaries. They provide stronger evidence than website language.
Testing should cover paperboard, coatings, inks, leakage, and heat resistance. Ask whether tests use current production materials, not old samples. Food-contact certificates must identify the material, test method, issuing laboratory, and validity period. A certificate without matching product specifications is weak evidence. Verify the laboratory independently when possible. During factory visits, inspect sealed cartons, batch labels, and retained samples. These details connect paperwork with real production. Still, audits are imperfect. A clean visit may not represent every shift or subcontracted process. Buyers should repeat checks after major material changes. A short trial order can expose slow communication, uneven sealing, or damaged cartons before a larger contract.
7 Best Paper Cup Paper Manufacturers for Global Buyers
Anonymized buyer-audit benchmark comparing lead time, export reach, testing documentation, and food-contact certification readiness.
Lower lead time indicates faster production fulfillment. Higher values for export markets, testing documents, and food-contact certificates indicate broader international readiness. Supplier names are intentionally anonymized for buyer-side comparison.
Supplier Selection Matrix: Cost per Tonne, Recyclability, Yield, and Delivery Reliability
Selecting paper cup paper manufacturers requires more than comparing quoted cost per tonne. A cheaper reel can lose value through trim waste, curl, moisture variation, or slow customs clearance. I compare landed cost, usable yield, and delivery history together. For example, 190–320 gsm stock may suit different cup sizes, but conversion settings still change yield. Fastmarkets price assessments can support regional benchmark checks, although they do not replace supplier quotations.
Recyclability needs careful verification. CEPI’s 2023 statistics reported an 82% paper recycling rate in Europe during 2022. However, a recyclable fibre does not guarantee that every coated cup enters a suitable collection stream. Ask for coating composition, repulpability test results, fibre certification, and mill-level traceability. The World Bank’s 2023 Logistics Performance Index can help compare country-level transport conditions, but it cannot prove one supplier’s reliability. Request twelve months of on-time delivery data, not a confident promise.
Tips: Build a weighted matrix. Try 30% cost, 25% yield, 25% delivery reliability, and 20% recyclability. Then test two production reels before signing a large contract. I would not hide the weak point: reported yield often comes from controlled trials, while factory waste is messier. Include moisture limits, roll hardness, claim procedures, and replacement times in the contract. A supplier that answers slowly before the order may perform worse after it.